Economics
The Economics section displays all the key financial data for the Engagement/Engagement Group (subject to configuration). The economics data will update as edits to the Engagement are made, meaning you do not need to press Save before seeing how the economics will be affected. Before any edits to the Team section have been made. It is likely that Economics will look quite blank, but this will change as you start to add bookings to the Engagement.
Economics contains two main sections - the breakdown and the key metrics. The breakdown is at the top of the Economics table and shows the Net and Gross Revenue that will be realised across the different grades involved in the engagement. The key metrics then use the economic breakdown to run calculations. The calculations for each field have been set within Dayshape and are presented to the user through a tooltip (appears when hovering your mouse on parts of Dayshape) on the economic field name.
There are several options that can be selected to change the way that the Economics table is presented and this differs between an engagement and an engagement group.
For environments that are configured to operate with Multicurrency, the Display Currency drop-down, within the Economics section, will indicate which of the currencies is in force for the selected Engagement or Engagement Group.
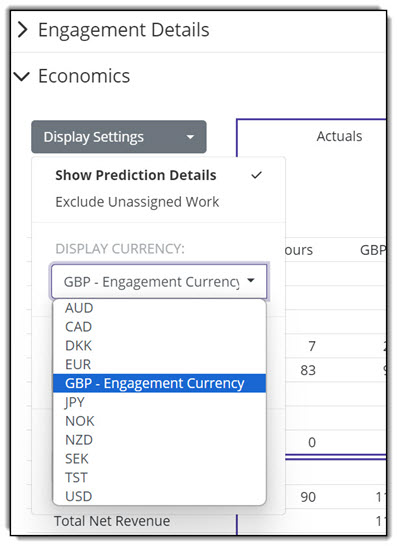
The Display Currency drop-down indicates the selected Engagement Currency
Selecting another currency for the Engagement does not change the default Engagement Currency until the selection is saved, at which point, the newly selected currency within the drop-down will be appended with “ – Engagement Currency” as shown in the above example image.
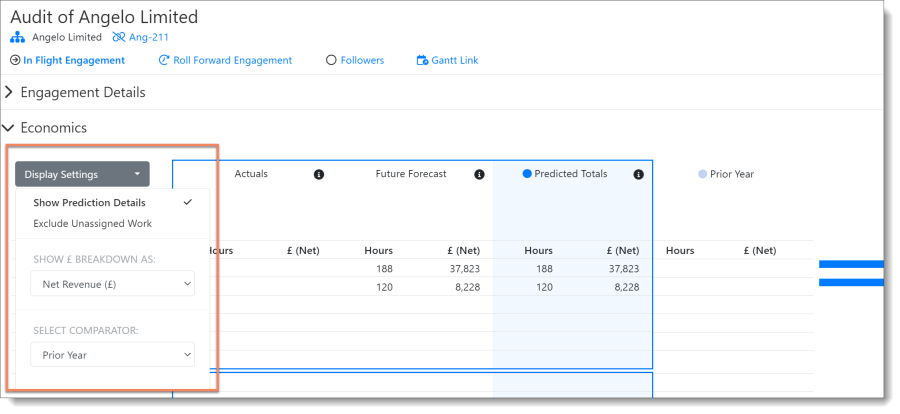
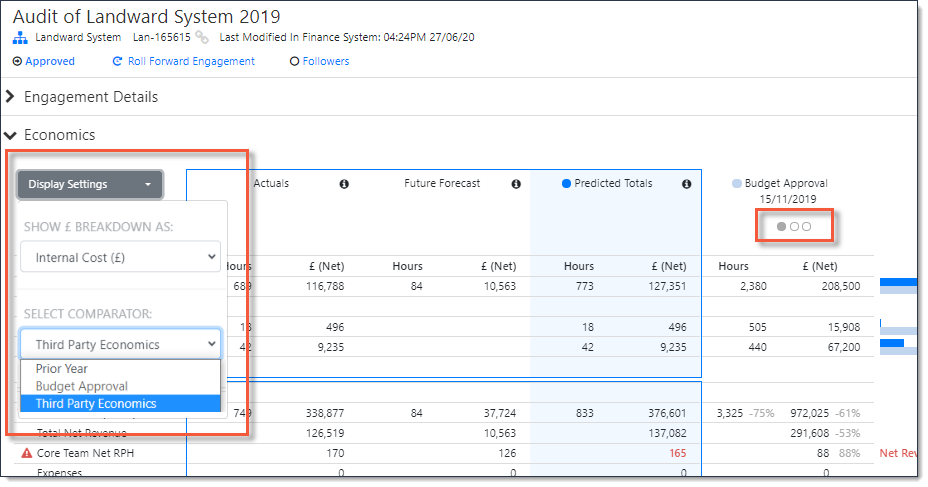
Engagement display settings
Click Display Settings:
-
Show Prediction Details - expands the table to show how the Predicted Totals are calculated
-
Exclude Unassigned Work - removes data related to bookings which has not yet been assigned out to Resources
-
SHOW BREAKDOWN AS - allows you to switch the breakdown between showing Gross Revenue, Net Revenue, Internal Cost, and Margin (all in the configured currency)
-
SELECT COMPARATOR - allows you to choose from the economics comparators configured for your system (described below)
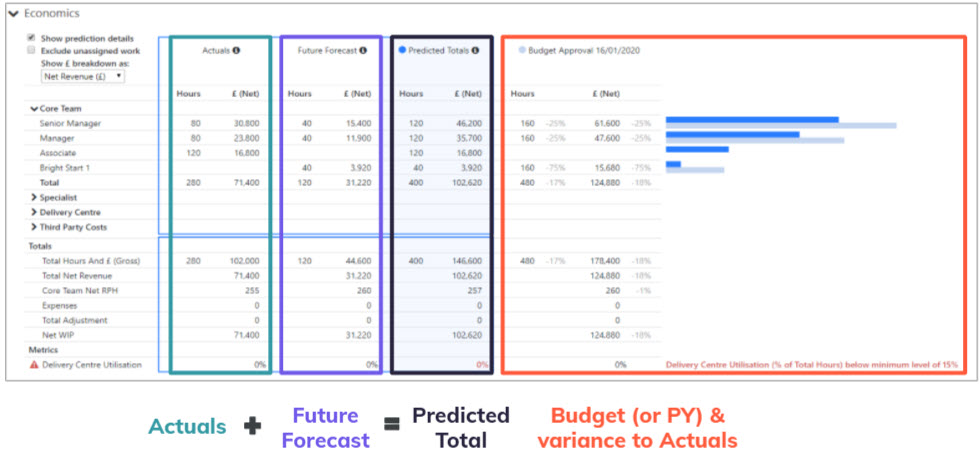
When the economics table is expanded (after selecting Show Prediction Details) you will see four main columns. These columns are the Actuals, Future Forecast, Predicted Total and, optionally, the Prior Year/Approved Budget/Third Party Economics column.
-
Actuals – contains only information that relates to the actuals, which would rely on Dayshape being integrated with a timesheet system that can provide this information. Any planned bookings that exist within Dayshape with a date in the past are ignored in the economics table.
-
Future Forecast - contains information from the planned bookings that exist in Dayshape and are planned to happen in the future.
-
Predicted Totals - is simply the sum of the Actuals and the Future Forecast column values.
-
Economics Comparator column - Prior Year/Approved Budget/Third Party Economics - a snapshot of the economic state at the point the Engagement budget/plan was approved - either from rolling forward a past Engagement or creating this one from scratch. This allows ease of comparison with the current Predicted Totals, thanks to the variance displayed through horizontal bars and percentage differences. Note that if showing the Approved Budget, you will see the most recent Approved Budget and can select older budgets (if they exist).
Your system may also have a 3rd party economics comparator set up, which can be displayed in place of the Prior Year or Approved Budget.
The information shown in the economic table will vary as the engagement progresses:
-
When you are first planning an engagement, all bookings should be in the future and therefore all economics will be seen in the Future Forecast column.
-
As an engagement moves to ‘In Progress’ status, some bookings will start to move into the past and the economics will be split across the Actuals and Future Forecast columns. This means that you have up-to-date information, indicating the financial health of an engagement while it is in flight (i.e., Managers can quickly determine where the project will be if they continue to follow the plan, and what effects changes to the plan may have).
-
Finally, once an engagement has been completed, all bookings should be in the past and therefore all the economics will exist in the Actuals column.
-
The final column can be set to show Prior Year or Budget Approval information for comparison purposes. Some systems may also be integrated with a Third Party Economics Comparator. The option to be viewed is selected within Display Settings | Select Comparator and the buttons below the comparator title can be used to toggle your view:
When the Budget Approval comparator is selected, and when more than one approved budget exists, you can decide to view any previously approved budgets or the current one. Whenever a budget is approved, it is added to the list and users can select the budget snapshot of their choice: Approved budget items are ordered in DESCENDING order from the most recent.
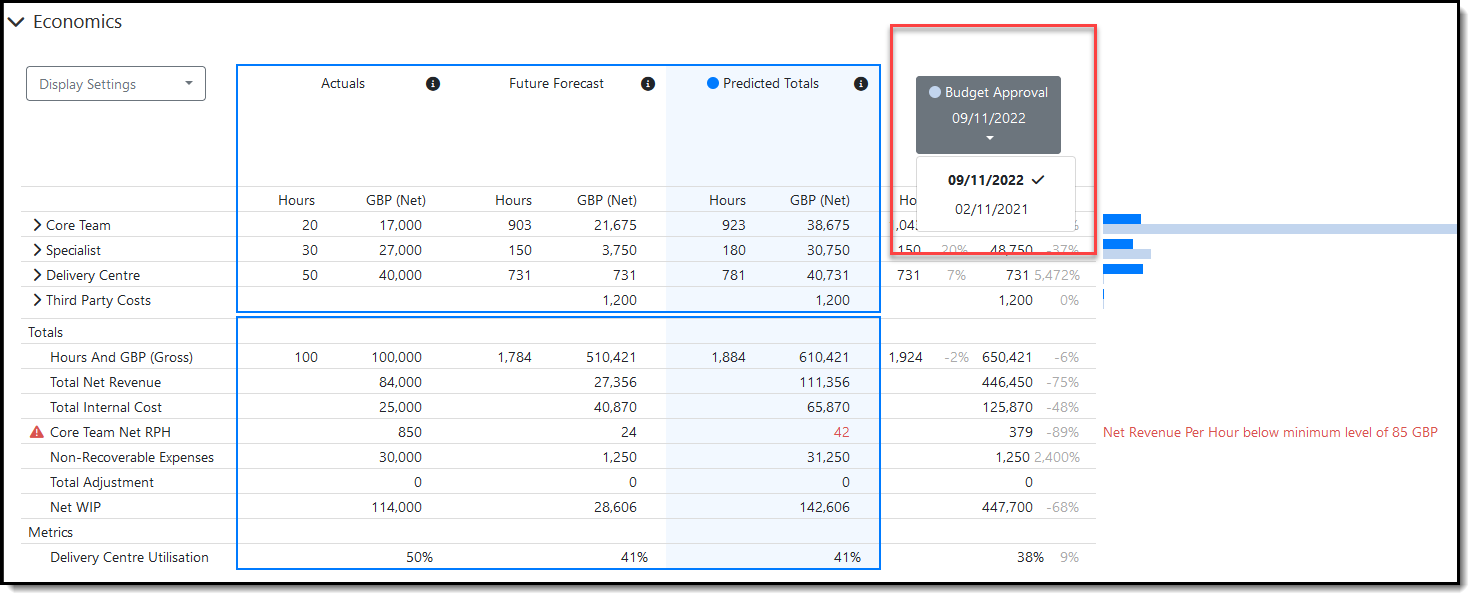
Approved Budget selector enables any historic approved budget’s economics to be shown in the comparator
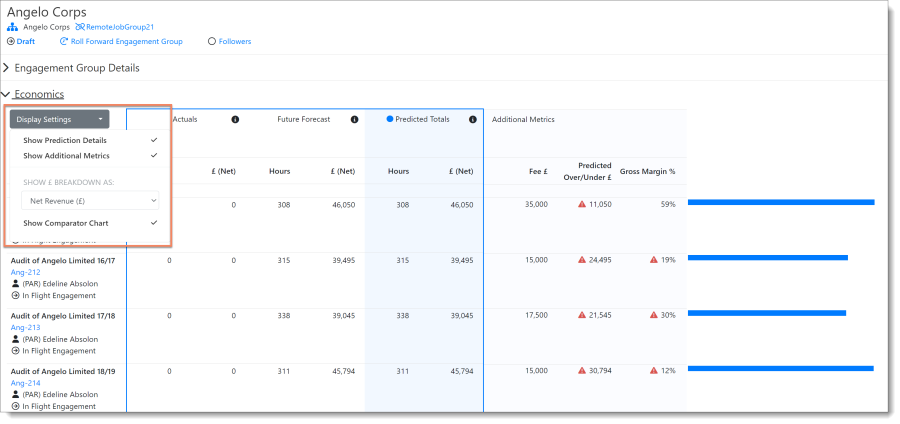
Engagement group display settings
The engagement group economics section displays each engagement linked to the engagement group.
Click Display Settings:
-
Show Prediction Details - expands the table to show how the Predicted Totals are calculated (as described previously for engagement)
-
Show Additional Metrics - up to five additional metrics can be configured for display here if selected (unique to engagement group and not displayed for engagements)
-
SHOW BREAKDOWN AS - allows you to switch the breakdown between showing Gross Revenue, Net Revenue, Internal Cost, and Margin (as described previously for engagement)
-
Show Comparator Chart - allows you to toggle the bar chart representation of the economics information (unique to engagement group and not displayed for engagements)